
Crunching numbers. Please wait...
TradingView is a web-based financial charting and data analysis platform which allows for relatively easy importing of custom data. Our gamma data is now available in a format which can be loaded onto a TradingView chart or to ThinkOrSwim.
TradingView
You can import data into TradingView by adding a custom indicator using the instructions below.
Initialize the Gamma Levels Indicator
Initial setup of our Gamma_Levels indicator requires a one-time copy and paste of either the single ticker file or the multi-ticker file into TradingView by following these 4 short steps:
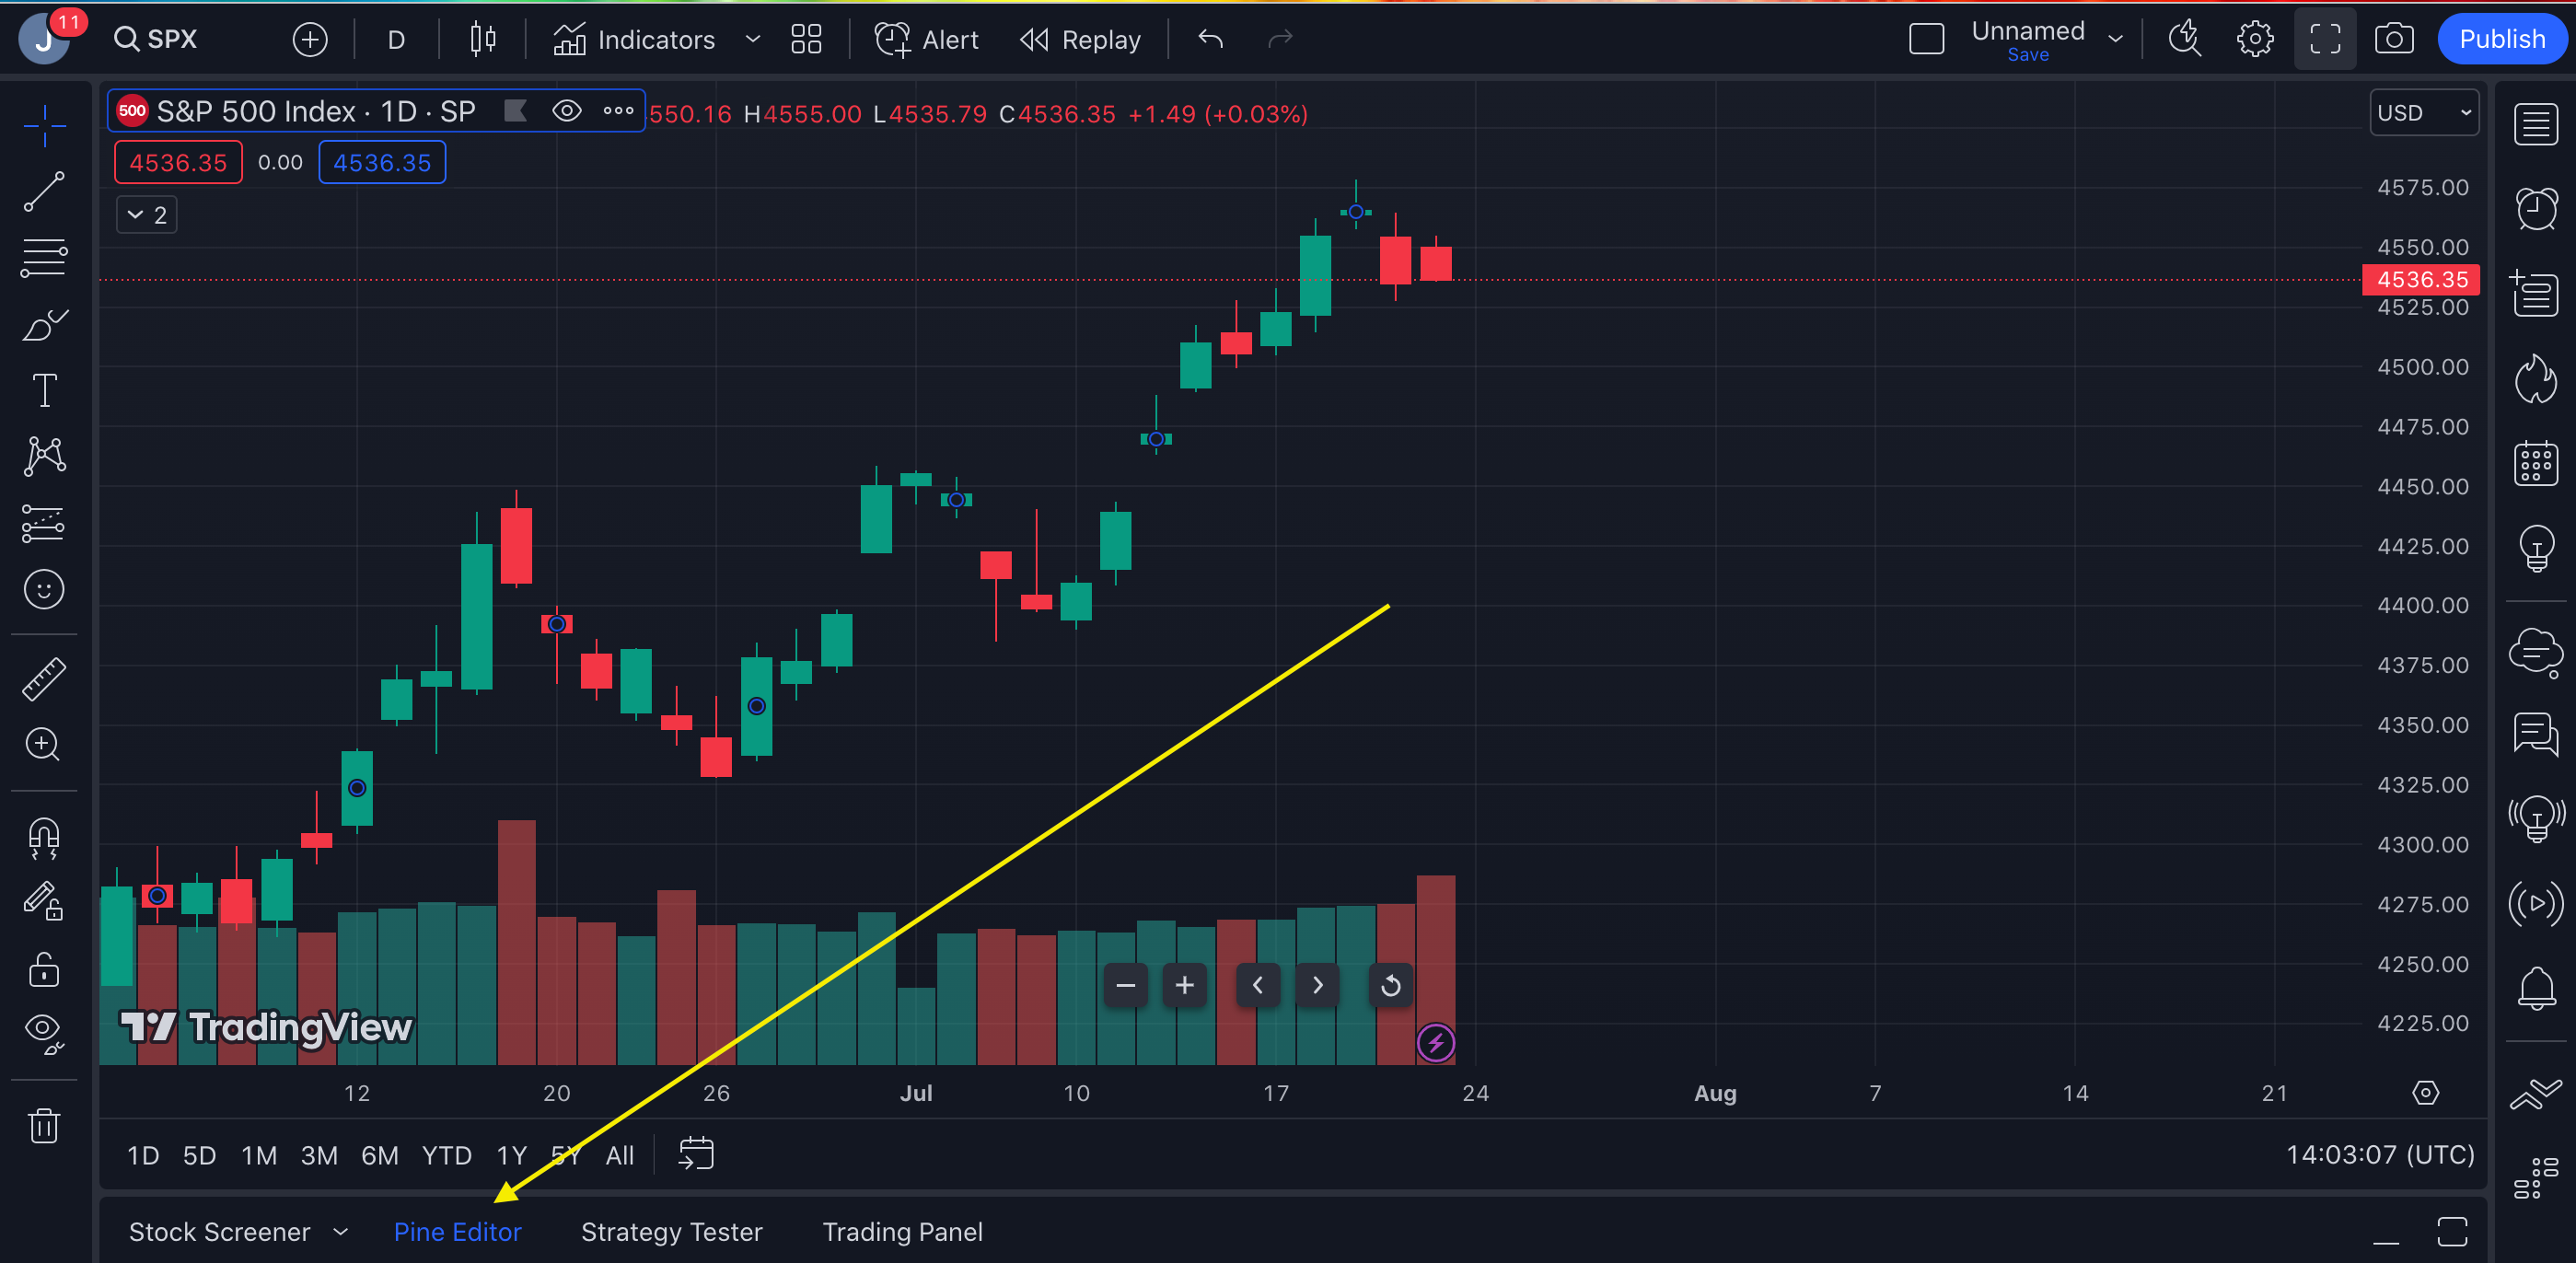
- Log in to your TradingView account (either free or paid) and go to the charts page
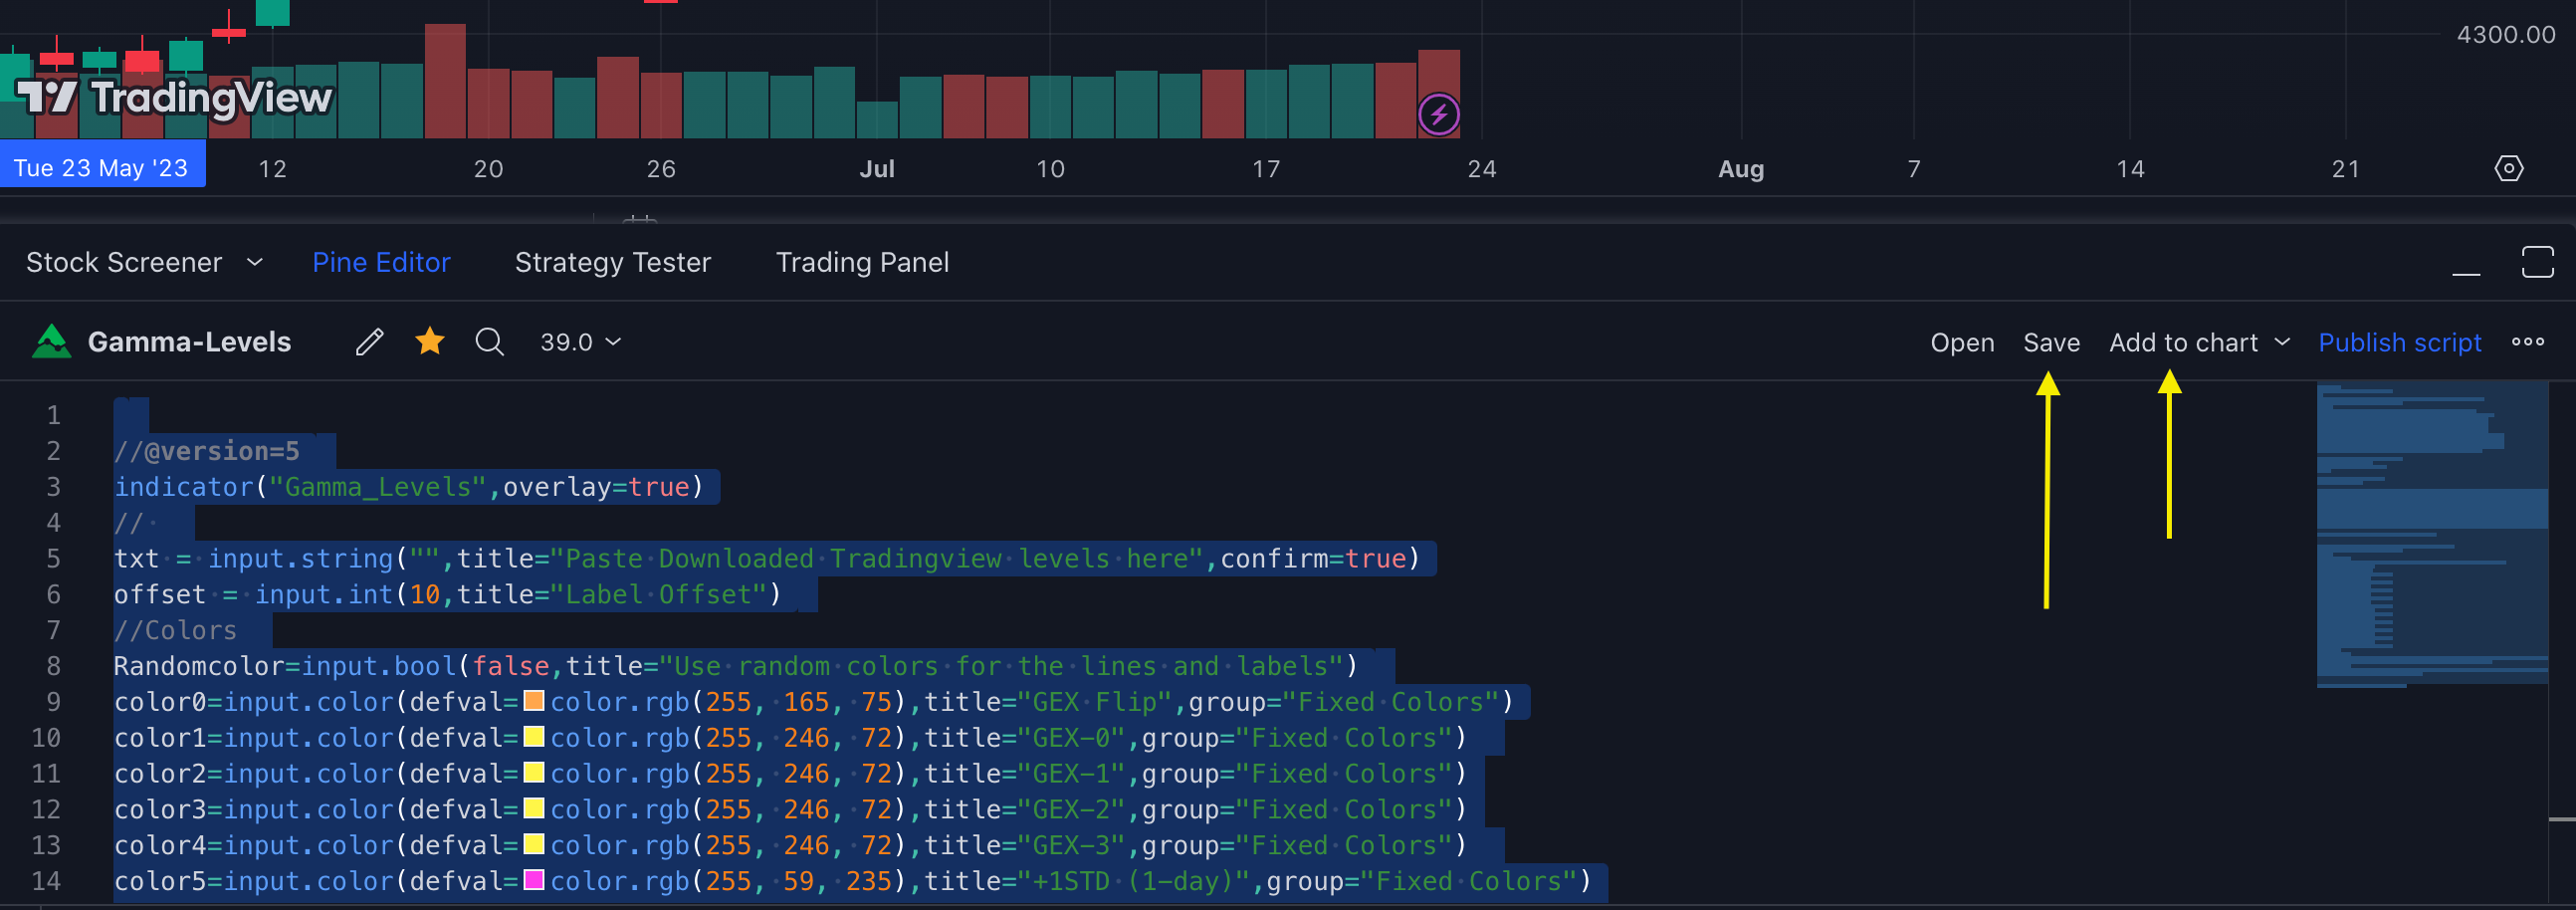
- Copy all the text from Pine source code file ( single or multi symbol )
- Open the Pine Editor Tab at the bottom of the page
- Paste the text from the file into the Pine Editor. Click “Save” and “Add to chart.” A new window will pop up — just click Apply.
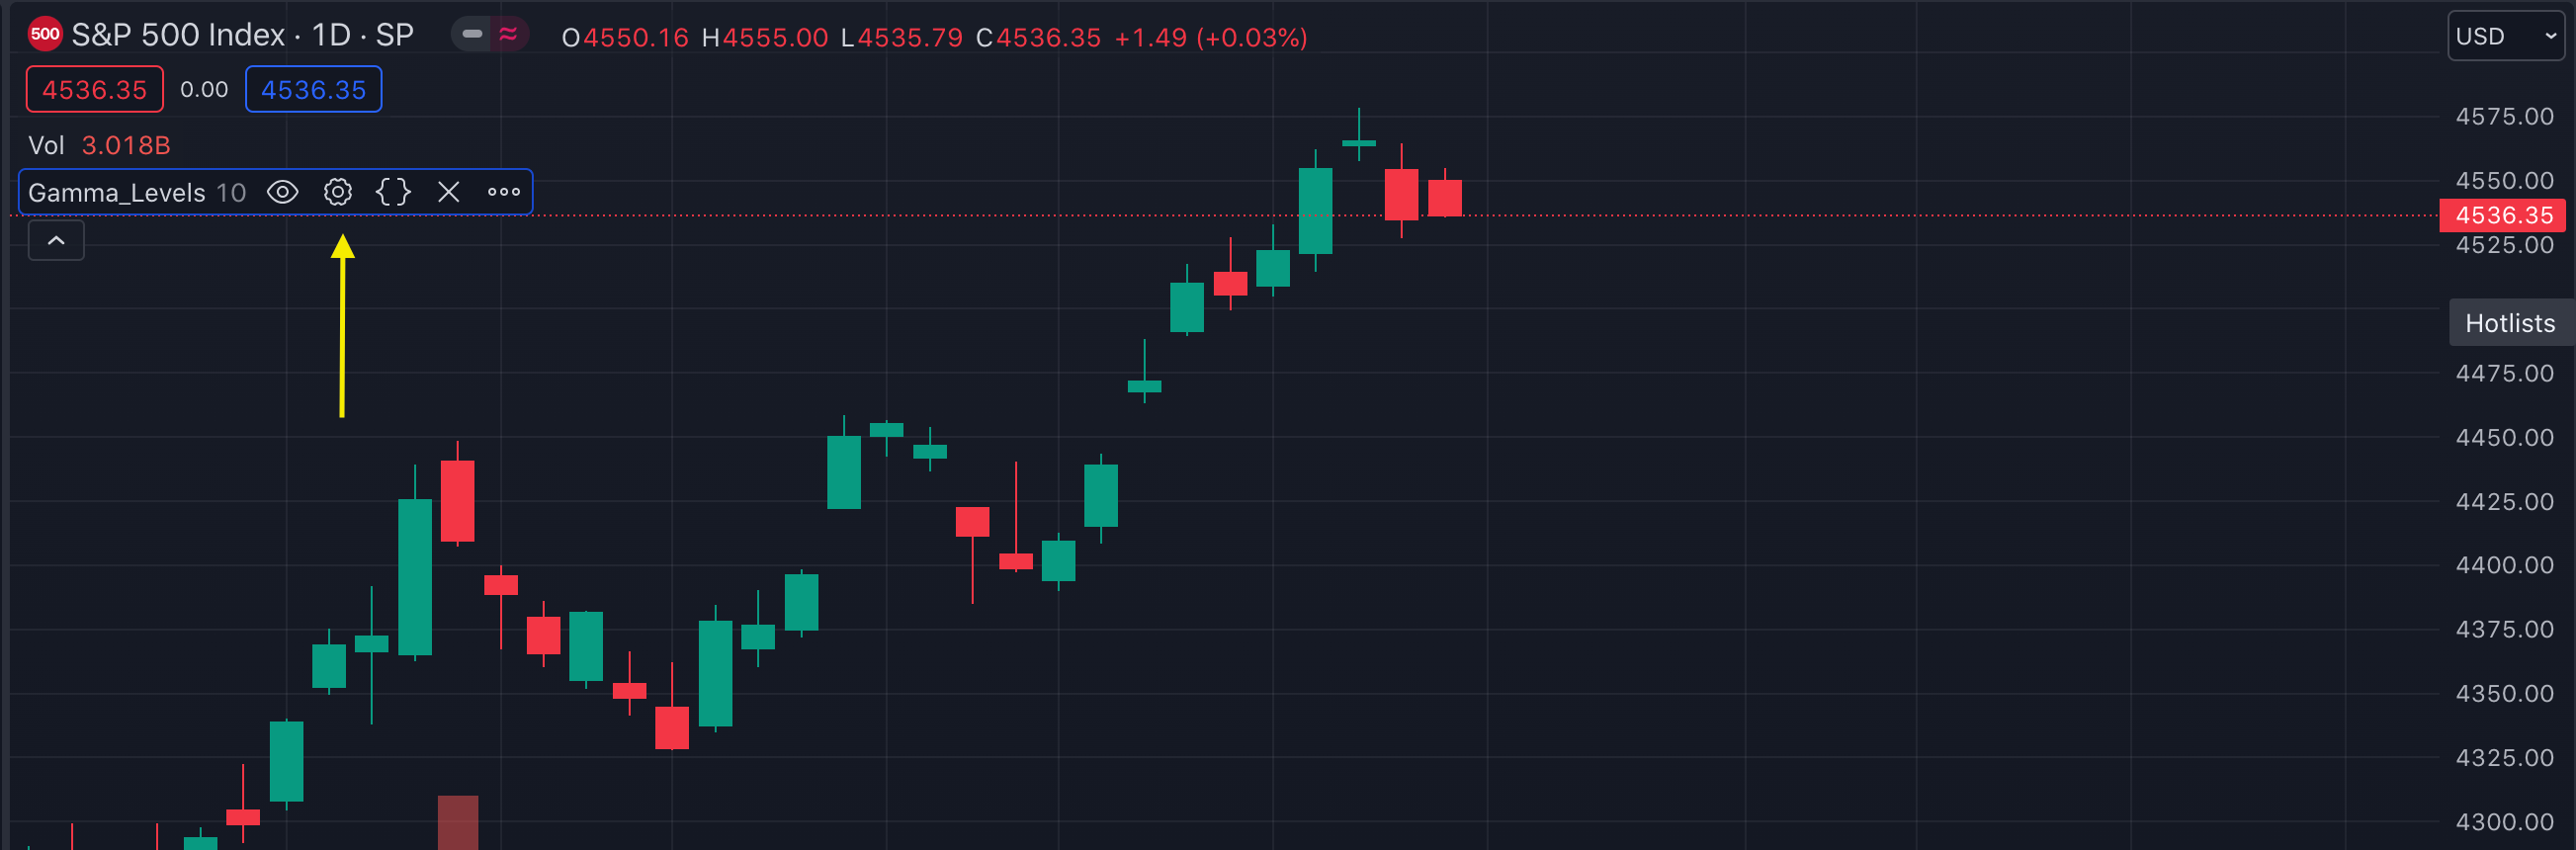
The Gamma_Levels indicator is now stored into your chart and you will see it in the top level of the chart. To load a stock’s Gamma Levels, we will edit the indicator by hovering over the Gamma_Levels text and clicking on settings (the gear icon).
Copy Gamma Levels Into TradingView
Next we will bring in our data for a given stock ticker with 3 steps.
- Grab the stocks’s data from the Trading Volatility website using our API. Note that your API key can be found on the Preferences page. Just enter the following into a new web browser window: https://stocks.tradingvolatility.net/api/gex/levels?username=YOUR_API_KEY&ticker=SPX
- The page response will be a string of text. Copy the page text into your clipboard (Ctrl+A then Ctrl+C).
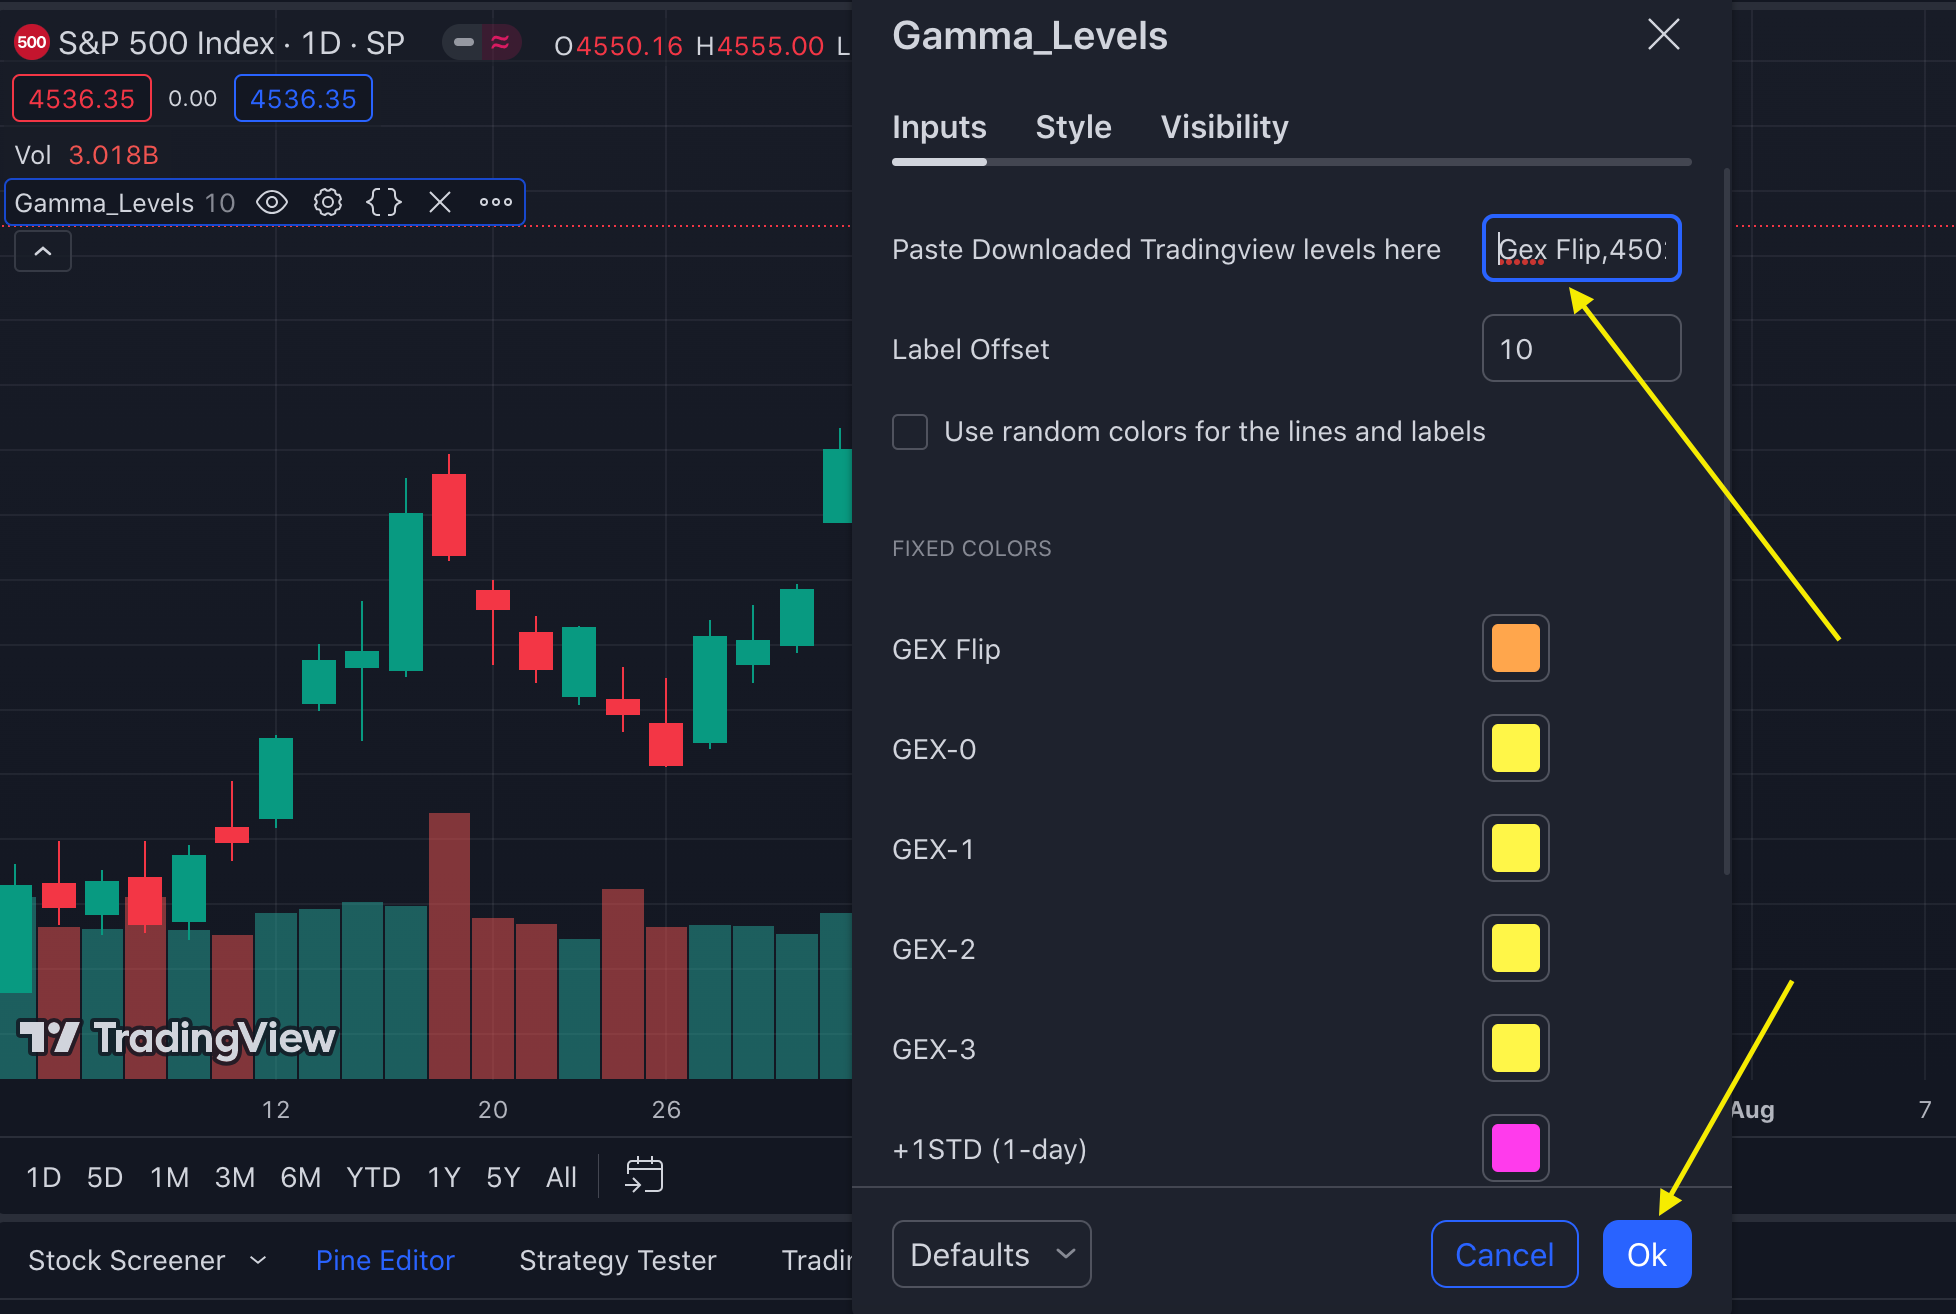
- Back on TradingView charts, Click the Gamma_Level indicator’s settings icon. In the pop-up window, paste the text from above into the box and click OK.

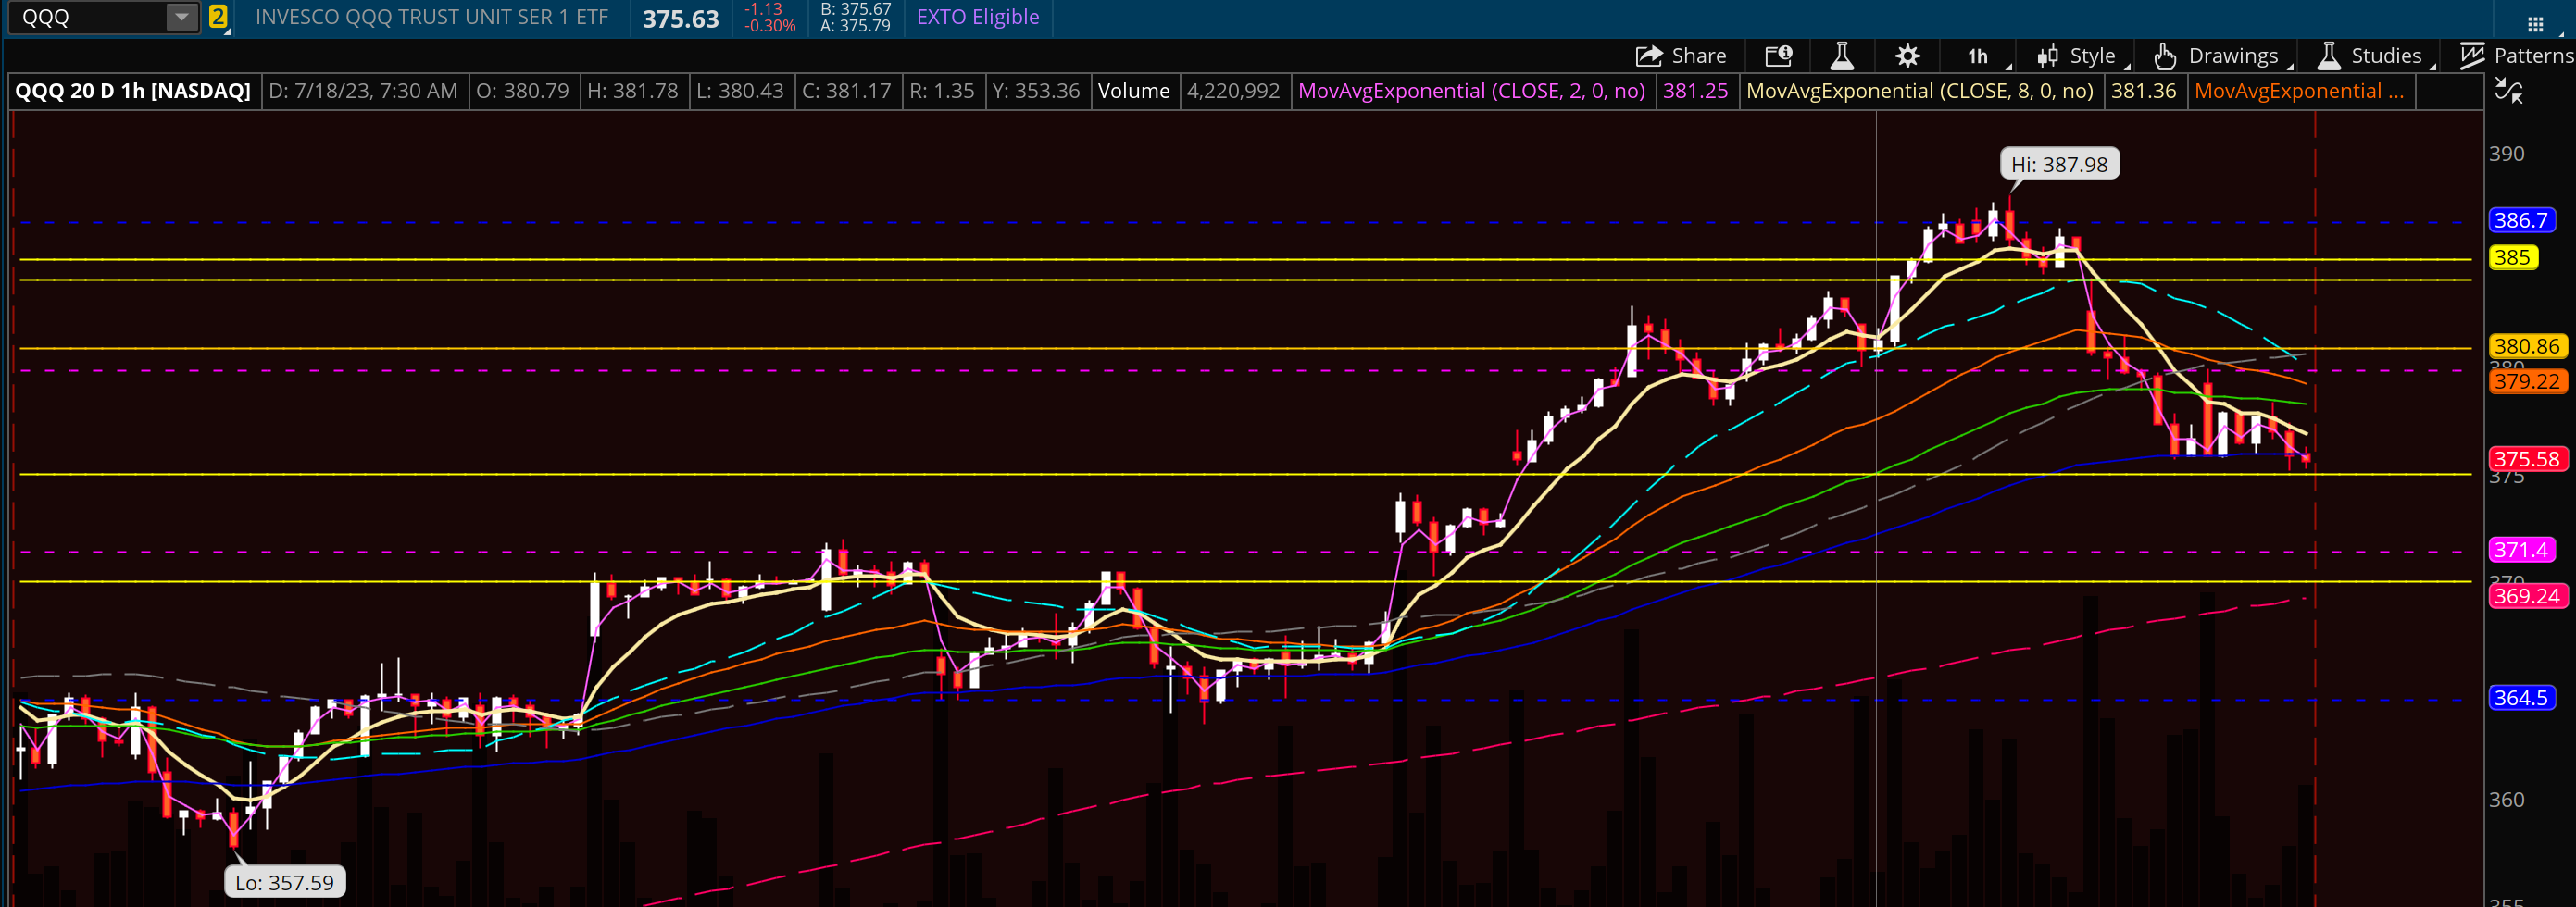
All done! Here’s the finished view for $SPX. This shows a chart with 1-hour candlesticks, but the levels will show on any chart timeframe you choose.
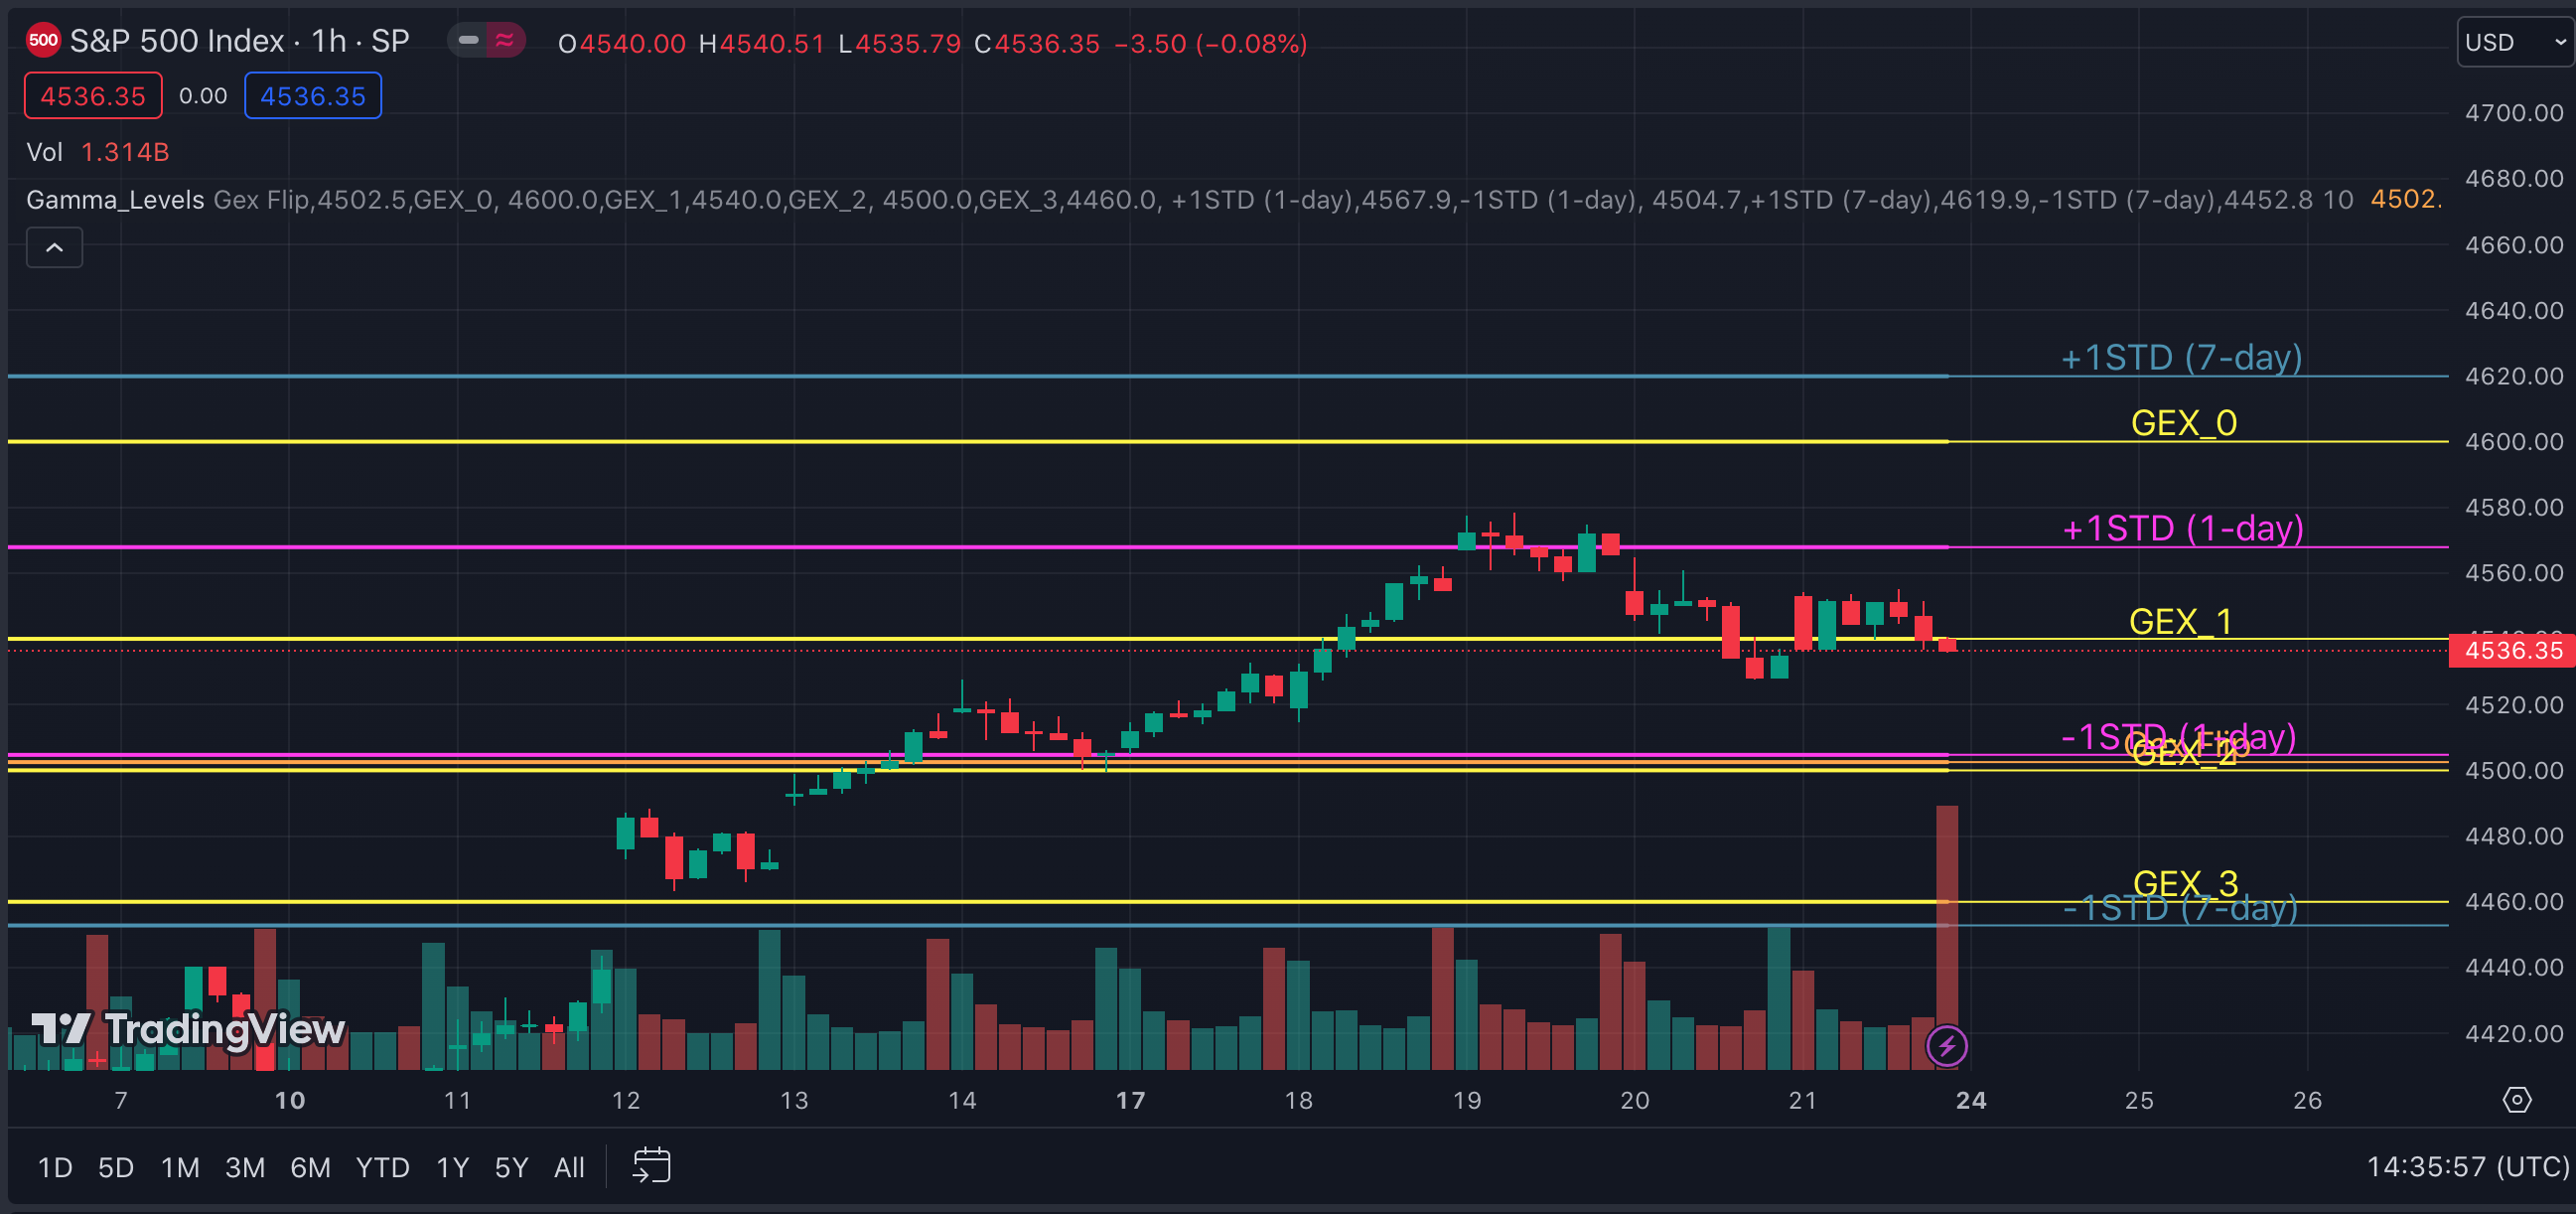
Our Gamma Levels are updated daily for nearly 1,200 stocks, ETPs, and indexes. You can repeat the method above to copy and paste the Gamma Levels for a given stock for that day.
ThinkOrSwim Charts
You can also add these levels into your ThinkOrSwim trading platform as a study.
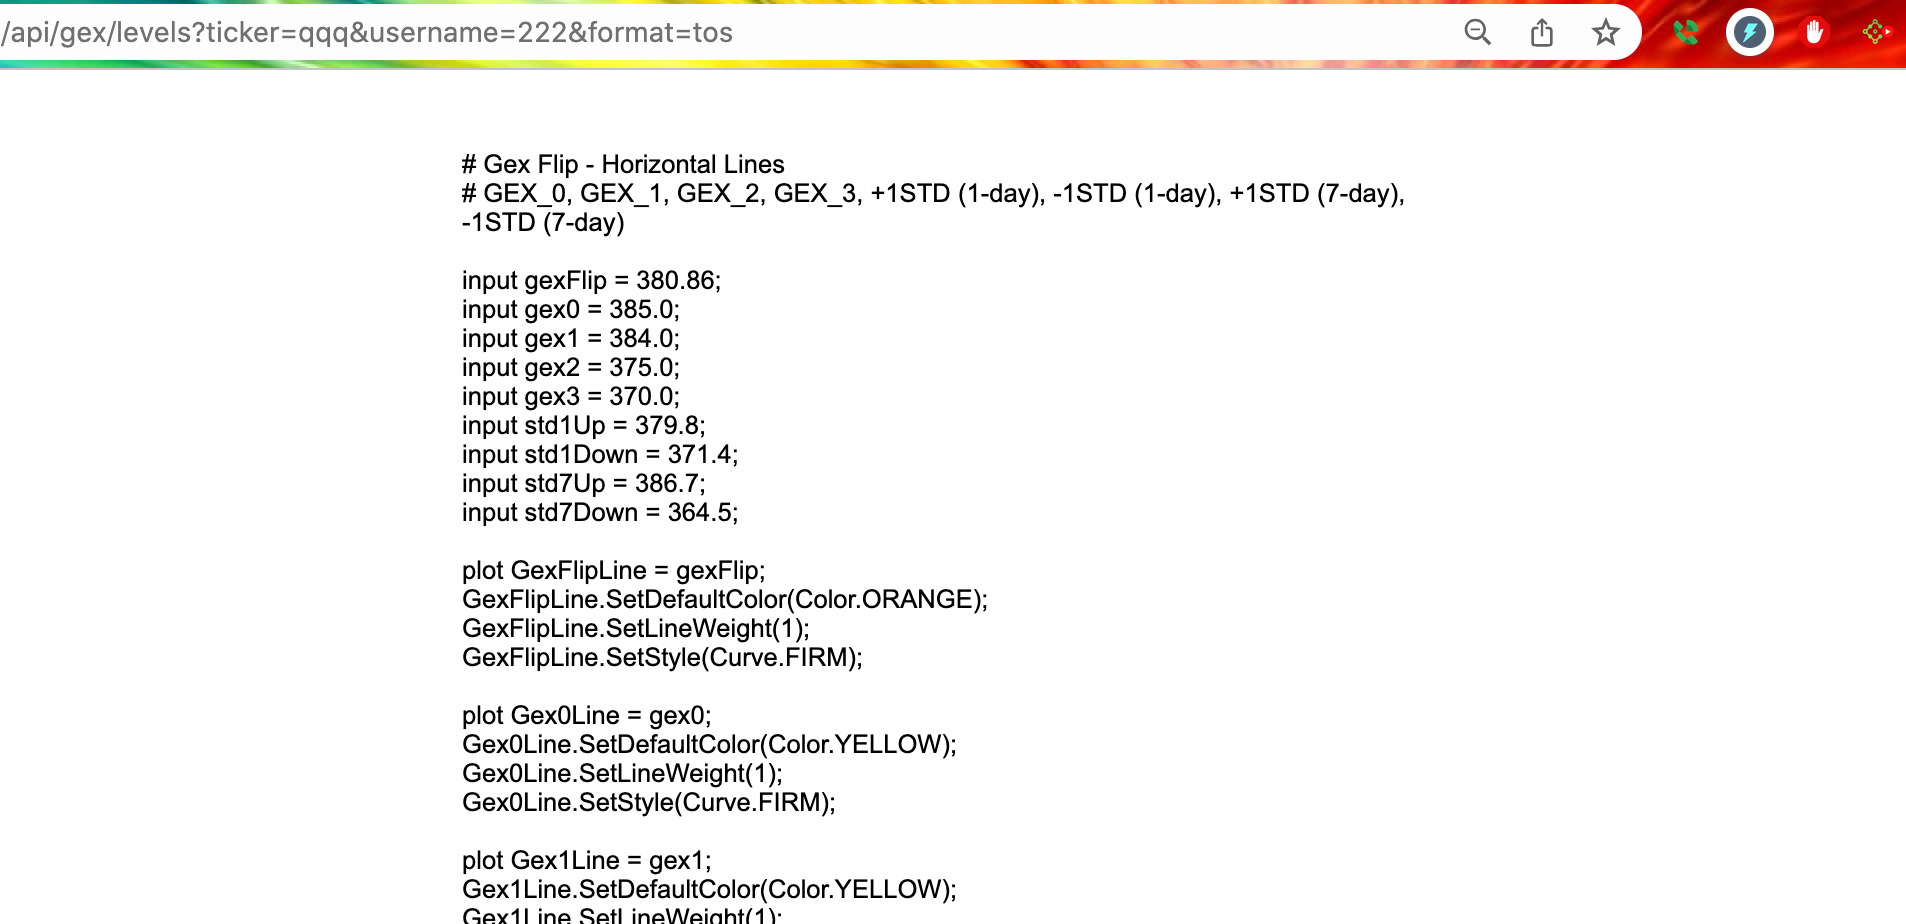
- Grab the data from Trading Volatility as above, using the “format=TOS” option. Enter the following into a new web browser window: https://stocks.tradingvolatility.net/api/gex/levels?username=YOUR_API_KEY&ticker=SPX&format=TOS
- Select all text and copy (CTRL+A then CTRL+C) the resulting text from the page.
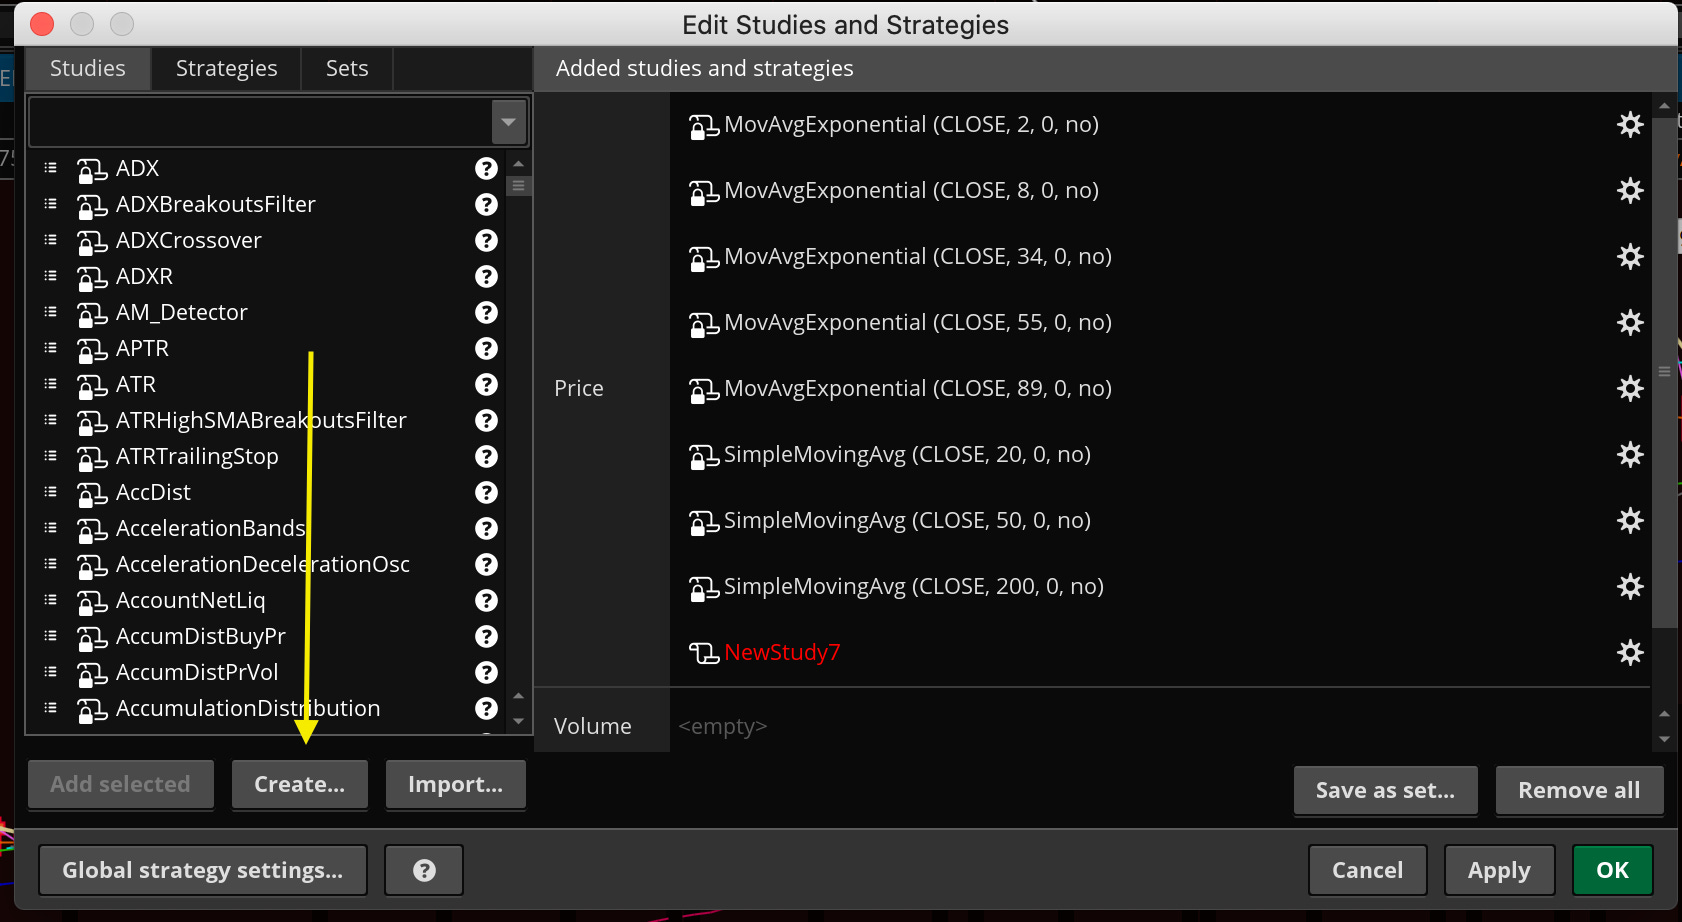
- In ThinkOrSwim, Click the Studies button
- Click ‘Create’
- Paste the text into the box
- Click ‘OK’ then click ‘Apply.
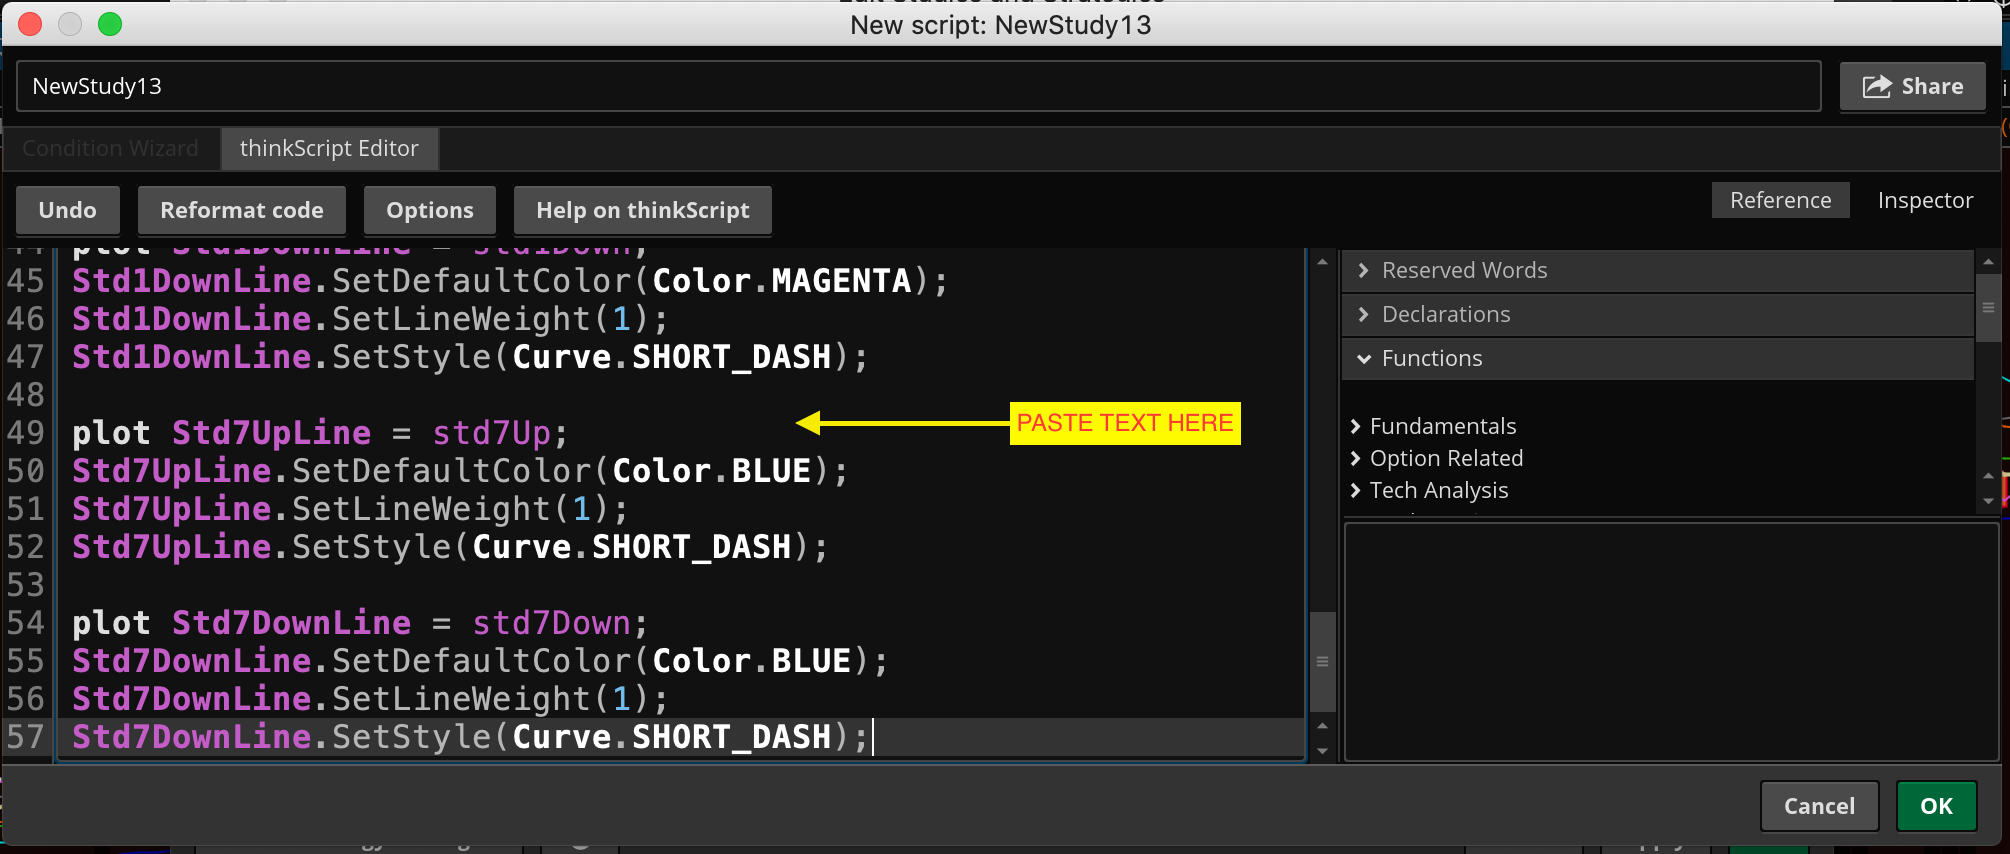
Done!
Note that stocks that don’t have significant gamma concentrations or enough gamma strikes may not return the full gamma data.