
Crunching numbers. Please wait...
Trading Volatility's Education Hub
This section will help you understand how to use our platform, interpret the data, and apply it to smarter, more confident trading. Whether you’re new to gamma or an advanced options trader, you’ll find guidance, definitions, and practical use cases here📬 Want more? Subscribe to our newsletter on Substack for insights on volatility, market structure, and gamma analysis.
1. What is Gamma?
Definition: Gamma is an options Greek that measures the rate of change of an option’s delta relative to a $1 move in the underlying asset’s price. It shows how sensitive an option’s delta is to price changes.
Why It Matters: High gamma indicates rapid delta changes, which can amplify or dampen price movements in the underlying asset, especially near key strike prices.
Trader Takeaway: Gamma highlights zones where price action may become volatile or stabilize, helping you anticipate market behavior.
2. How Market Makers Hedge (And Why It Moves Prices)
Market Maker Role: When a trader opens an option position, Market Makers take the opposite of the trade. They do not want any directional risk, so the aim to stay "delta-neutral" via hedging.
Hedging Mechanics:
- When market makers provide options, they take on delta exposure. To offset delta changes, they buy or sell the underlying asset (e.g., stocks) in an amount that is equal to their delta exposure.
- MMs will also carry gamma exposure, which determines how they should adjust their hedges as the underlying price moves.
- Positive Gamma: When long gamma (e.g., from selling options), they buy as price decreases and sell as price increases. This acts to stabilize price and reduces volatility.
- Negative Gamma: When short gamma (e.g., from buying options), they sell as price decreases and buy and price increases. This amplifies price moves (e.g., gamma squeezes).
Price Impact:
- Pinning: Near high-gamma strikes, market makers’ delta-neutral hedging can stabilize price around that level, often leading to pinning, especially close to expiration when gamma peaks.
- Accelerations: When price moves through a highneg negative gamma strikes, rapid hedging (buying/selling the underlying) can fuel momentum.
- Reversals: If price moves far from a gamma wall, gamma decreases and hedging pressure decreases, allowing for price to move more freely -- consolidation or reversals.
Why It Matters: Market maker hedging creates feedback loops that influence price behavior, especially in liquid markets (e.g., SPY, QQQ).
Trader Takeaway : Watch for high open interest strikes and expiration dates to predict where hedging will impact price.
3. Key Concepts
Positive vs. Negative Gamma:
- Positive gamma dampens volatility (market makers stabilize price).
- Negative gamma increases volatility (market makers amplify price swings).
Expiration Effects:
- Gamma’s influence peaks near expiration (weekly/monthly), as hedging intensifies.
- Call Resistance: Heavy positive gamma from calls can limit upward price moves and stabilize price.
- Put Support: Heavy negative gamma pushes price lower. Hedging pressure decreases as price move away from gamma concentrations or if Vanna dynamics from changing IV overcome the negative gamma pressure.
- Pinned Price: The price where one gamma level dominates, specifically near expiration.
- Gamma Squeeze: Price moves force Market Makers carrying negative gamma to chase price (e.g., buying stock as it rises), amplifying momentum. Common in stocks with a large amount of speculative calls, e.g. TSLA, GME, AMC.
- A "Gamma Call Ladder" is formed for speculative stocks when there is relatively little put gamma across strikes, and there is a series of significant call gamma clustered across multiple strikes above the current share trading price. This results in high volatility conditions that can push the stock quickly higher.
- The gamma structure of daily SPX index options provide insight into intraday movements in SPX. See our Gamma Structure Cheat Sheet for SPX.
Limitations:
- Gamma is most relevant in liquid markets with high options activity (e.g., SPX, NVDA).
- External factors (market-critical news and data) can override gamma effects.
4. How Can I Use Gamma?
Identify Key Price Zones:
- Use gamma exposure (GEX) data to find strike prices with high gamma levels.
- Clusters of GEX can be aggregated to simplify key price zones where gamma is concentrated.
- These zones often act as support/resistance or pinning points, especially near options expiration with large open interest (monthly/quarerly).
Timing Entries and Exits:
- Range bound trades: Enter trades around high positive gamma strikes where price may oscillate (e.g., buy as price dips below the gamma levels & sell above).
- Support: Look for support slightly below high levels of negative gamma, as price decelerates. Reversals higher happen as decrease in IV results in Vanna buying.
- Gamma Flip: Watch for price levels where gamma flips from positive to negative (or vice versa), as this can signal a significant change in price dynamics.
- Pinning: Near significatn expirations (quarterly, monthly, weekly), expect price to stabilize near high-gamma strikes.
Trader Tip: Combine gamma analysis with technical indicators (e.g., support/resistance, RSI) and market news to avoid overreliance.
Getting Started
New to Options or Gamma?
Trading Volatility was built for self-directed traders at all levels. Whether you’re just beginning your options journey or you're an experienced trader exploring new tools, we’ve structured the platform so you can learn and scale up at your own pace.
Step 1: Start with Ratings and Dashboards
We recommend beginning with the ratings page and My Dashboard, which offer a simplified view of current opportunities based on our AI-powered analysis.
- Ratings are updated twice daily (open and close) and show a stock’s directional bias.
- My Dashboard helps you track a custom watchlist of stocks and key metrics. Here is a Guide on how to use it.
- You can easily sort and filter based on Bullish, Hold, Avoid, and other signal types.
- Export the gamma levels on your watchlist for easy importing into TradingView or ThinkOrSwim.
Step 2: Enable Daily Email Alerts
To stay informed without checking constantly, enable daily email notifications for "My Dashboard Summary" in your Alerts / Preferences settings.
- You'll receive an evening summary with all updates to your selected stocks.
- Great for catching rating shifts without being glued to your screen.
Step 3: Build Familiarity with Gamma Concepts
Much of our advanced content relies on an understanding of options greeks, particularly Gamma, Delta, Theta, IV, and Skew. If you're unfamiliar with these, we recommend brushing up through the following:
- Our "New to Gamma?" section above
- Books or courses focused on options trading basics
- Following our blog and Substack newsletter for practical insights
Optional Tools Once You’re Comfortable
Once you're familiar with the basics, explore additional tools like:
- GEX Dashboards — to view gamma metrics for a universe of stocks
- Skew & IV Charts — to understand market sentiment and expected moves
- GEX Charts — to analyze historical gamma trends and patterns
- Dark Pool Charts — to gauge institutional sentiment and activity
- Put/Call Dashboard — to assess market sentiment and positioning
- Idea Dashboard — to discover new trading ideas based on our analysis
The platform is designed to grow with you — start simple, learn the signals, and layer in complexity as you gain confidence.
Advanced Options Flow Diagnostics
Once you’re comfortable with the core concepts (Gamma, Delta, IV, and Skew), the next step is understanding how options are actually being traded today — not just where open interest sits. Our Options Flow Diagnostics condense high-volume options activity into a few readable signals that help answer one key question:
Is today’s options activity speculative, structured, hedged, or directional?
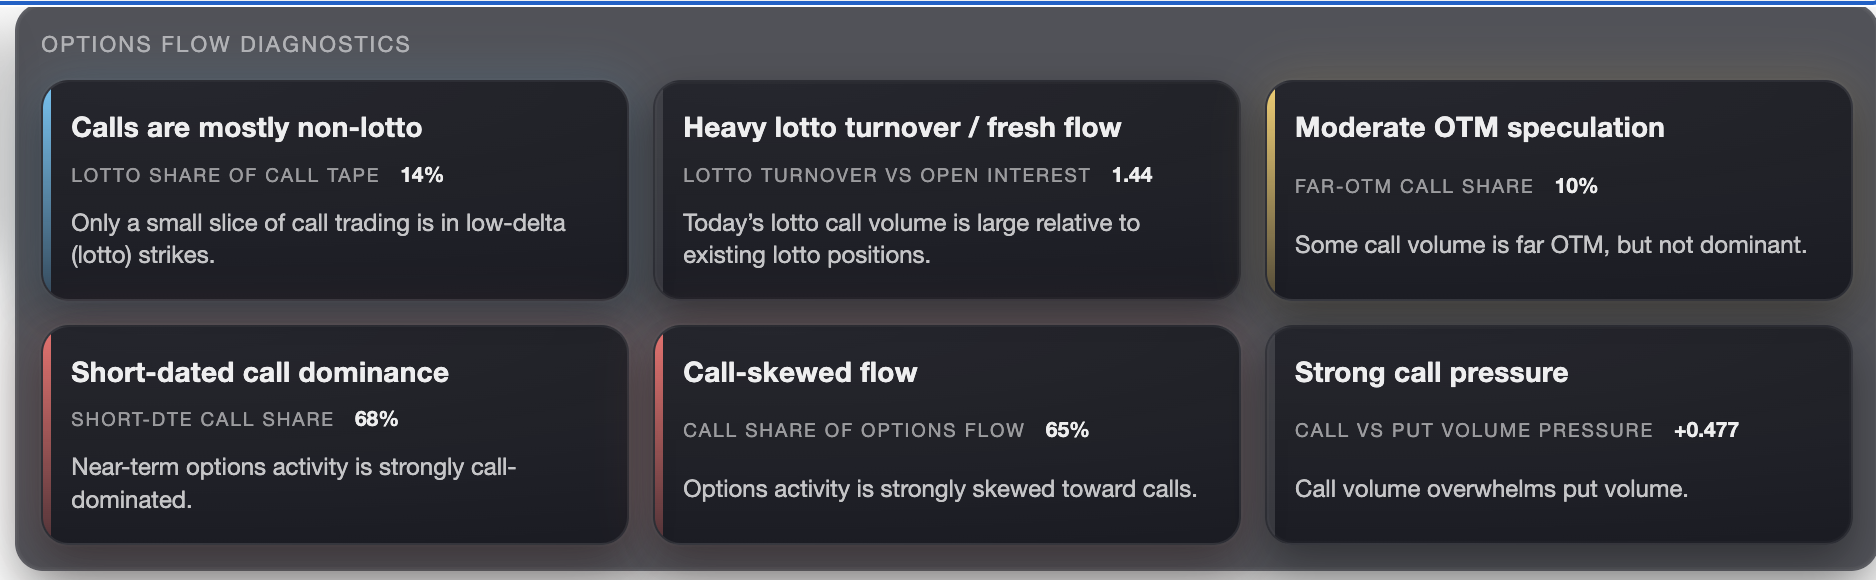
Each card highlights a distinct dimension of flow — participation, freshness, aggressiveness, near-term bias, and pressure. Used together, these metrics add context to GEX/IV/Skew and help you interpret whether moves are likely to persist or fade.
What the Signals Mean
1) Lotto Participation
Lotto Share of Call Tape measures how much call volume is in low-delta, out-of-the-money contracts. Low values suggest more structured/hedged activity; high values suggest speculative “lotto” behavior.
2) Fresh Speculative Flow
Lotto Turnover vs Open Interest compares today’s lotto call volume to existing lotto call open interest. Elevated readings indicate unusually heavy new participation or churn relative to what was already open.
3) Aggressiveness of Upside Targeting
Far-OTM Call Share shows how much call volume is concentrated in far out-of-the-money strikes. Higher values imply more aggressive upside targeting vs near-ATM/structured flow.
4) Near-Term Directional Bias
Short-DTE Call Share isolates short-dated options activity (e.g., ≤ 14 DTE) to reveal whether near-term trading is leaning toward calls or puts — where gamma effects are often strongest.
5) Overall Directional Skew
Call Share of Options Flow provides a high-level directional tilt by comparing call volume to total options volume. Best interpreted as bias, not intensity.
6) Call vs Put Pressure
Call vs Put Volume Pressure measures how strongly one side dominates the tape (beyond simple share). It’s a normalized imbalance that captures conviction, not just participation.
Flow Regimes (Putting It All Together)
Rather than forcing you to interpret each metric in isolation, we combine them into simple flow regimes that describe the overall “character” of the options tape.
- Hedging / Overwrite — call activity looks more like structured selling/overwriting than speculative demand.
- Mixed — signals conflict; speculative demand may be present but not dominant.
- Speculative Call Demand — lotto/far-OTM/short-dated bias plus call-heavy tape indicates risk-on call demand.
- VIX Call Demand — in VIX-family products, call activity can reflect long-vol protection rather than bullishness.
How to Use These Metrics
These diagnostics are not standalone trade signals. They are best used to:
- Validate or challenge price-based setups
- Understand whether moves are supported by fresh participation
- Adjust expectations for follow-through, volatility, and reversals
- Distinguish hedging/overwrite activity from speculative demand
Price tells you what happened. Options flow helps explain why — and whether it’s likely to persist.
Using Ratings, Dashboards & Alerts
What Are Ratings?
Gamma analysis requires a deep understanding of options modeling and greeks. Our Ratings are automatically generated based on the current state of the stock's gamma structure, IV, and Skew.
Ratings can be used by customers as an initial tool to screen, sort, and analyze opportunities.
Ratings for nearly 1,000 stocks are updated once in the first 40 minutes of trading and again in the last 40 minutes of trading.
Our automated ratings system classifies stocks based on gamma structure, IV, and skew:
- 5 – Bullish
- 4 – Hold
- 3 – Avoid
- 2 – Wait
- 1 – Bearish
Trading Volatility does not provide any personalized financial advice. Ratings are not intended to be investment advice to buy or sell any security.
What is Vanna?
Definition: Vanna measures how much an option’s delta changes as implied volatility (IV) changes. It’s crucial because market makers hedge not just against price movement, but also against shifts in volatility.
Why It Matters:
- Vanna becomes especially important during earnings, macro events, or any environment where volatility is expected to shift quickly. As implied volatility rises or falls, market makers adjust their hedges, which can create directional flows in the underlying asset—even when the price hasn’t moved yet.
- Vanna flows can front-run or amplify price moves purely from volatility shifts, creating a feedback loop between IV and price.
Trader Takeaway: During volatility crushes (post-earnings, FOMC), vanna unwinds can push price in unexpected directions. You can anticipate these flows by watching for changes in implied volatility near key strikes or using vanna exposure charts.
How Market Makers Hedge (And Why It Moves Prices)
Market makers aim to stay delta-neutral. Vanna positioning determines what action market makers take as implied volatility changes. Their reactions depend on the vanna regime:
- Positive Vanna: As IV rises, MM deltas increase, so market makers sell the underlying to stay delta-neutral → can dampen upward moves or exacerbate downward moves
- Negative Vanna: As IV rises, MM deltas decrease, so market makers buy the underlying to re-hedge.
Key Concepts
- Volatility Stabilization: Heavy negative vanna can lead to buying flows during IV spikes, providing support in a declining market.
MM VEX Positioning Summary
For short puts:- MM deltas are positive. Short stock to stay neutral.
- Vanna exposure is negative. An increase in IV moves deltas toward zero, which makes MM deltas less positive. MM buys to re-hedge.
- Vanna exposure is positive. An increase in IV makes put deltas more negative, which makes MM deltas more positive. MM shorts more to re-hedge.
For long calls:
- Deltas are positive. Short stock to stay neutral.
- Vanna exposure is positive. An increase in IV makes call deltas more positive, which makes MM deltas more positive. MM shorts more to re-hedge.
- Vanna exposure is negative. An increase in IV moves deltas toward zero, which makes MM deltas less positive. MM buys to re-hedge.
What is Charm?
Charm, also known as delta decay, measures how much an option’s delta changes as time passes. It’s a second-order Greek that becomes critical near expiration, especially for options near the at-the-money (ATM) strike
Why It Matters:
- Charm creates predictable, scheduled flows, especially noticeable into Friday option expirations or during large open interest weeks. It helps explain why markets drift in certain directions without news.
How Market Makers Hedge (And Why It Moves Prices)
Market makers hedge delta exposure, and as delta decays, they must adjust their stock positions daily.
Negative net charm means MM deltas decrease. This means the must re-hedge by buy shares to remain delta-neutral.
Key Concepts
- Charm builds pressure quietly. It's not event-driven — it's clock-driven.
MM CEX Positioning Summary
For short puts:- MM deltas are positive. Short stock to stay neutral.
- Charm exposure is positive. A passing day moves deltas toward -1 so MM deltas move toward 1. MM shorts more to re-hedge.
- Charm exposure is negative. A passing day moves deltas toward zero. MM buys to re-hedge.
For long calls:
- Deltas are positive. Short stock to stay neutral.
- Charm exposure is negative. A passing day moves deltas toward zero. MM buys to re-hedge.
- Charm exposure is positive. A passing day moves deltas toward +1 so MM deltas move toward +1. MM shorts more to re-hedge.
- Look for a Gamma Call Ladder.
- GEX / Avg Volume less than -0.4.
- High short interest (>30%) amplifies potential moves.
- GEX Dashboard Filter: GEX = Negative, Call Skew = Positive, IV = High (75+)
- Sort by GEX Change
- Click through to stock's GEX Charts page to confirm negative correlation between GEX and RISING price to avoid false signals. If history shows price falls during negative GEX, or prices rises with positive GEX, you can't use this strategy on this ticker.
- Skew Dashboard Filter: Call Skew = Positive, IV > 126, BB Width > 10
- Sort results by IV column
- Good for straddles or directional plays
- Note: Stocks under $5 generally have widely spaced option strikes relative to trade price (in percentage terms), which makes them prone to a larger margin of error in the GEX and GEX calculations. These stocks are generally best avoided.
- Have a defined process on your option trades. What are the conditions to open the position? What is the structure of the trade? What are the conditions to close the position?
- Always be aware of event risks for a stock such as earnings reports. Earnings report days often have a large amount of implied volatility that is priced in, and that IV falls significantly after the event.
- Plan and identify price levels where you want to buy options. For example, don't decide to buy some calls on a day when the stock is up a bunch and chase price higher.
- IV, Delta, and Theta are important to understand when buying options, but they are critical when buying OTM options. You can still lose money on options even if you make the right call on the underlying directional move.
- Theta hurts an option's value the most in the week of expiration. Options with more than 60 DTE have smaller theta. Once there is less than 20 DTE theta really starts to increase. Deep in the money options have the least theta since those options are mostly intrinsic value there isn't much theta to decay (Theta is the decay of extrinsic value).
- Generally you don't want to hold options until expiration. Instead, sell after hitting your price objective or reaching your max loss. Sell/roll at least a few days prior to expiration if needed.
- The fewer the days to expiration the less room for error you have.
- Zero Days-to-Expiration (0DTE) options are high risk and have severe price fluctuations. Intraday price fluctuations make stops almost impossible to use and it's better to size-down your position instead of using a stop. For example, rather than use a stop at 50% just reduce your trade size by half with the assumption that it expires worthless.
- GEX is now provided in terms of $ per 1% move, with resepect to Market Maker's exposure.
- Previously we provided a "Naive GEX" and "Skew Adjusted GEX" (SA-GEX). As of May 15, 2025 we have updated our GEX models so that only one model is required.
- Our model utilizes several skew measurements to adjust the estimated MM exposure.
- Positive Skew Adjusted GEX: Daily movement subdued as Market Makers re-hedge by buying as stock price falls, and adding to their short as stock price rises.
- Negative Skew Adjusted GEX: Daily movement accentuated as Market Makers re-hedge by buying as stock price rises, and adding to their short as stock price falls.
- (For additional details, see notes below and this blog post.)
- Our data looks at all options with less than 94 days to expiration.
- GEX is expressed as "GEX($) per 1% move" the equivalent dollar value of GEX for a 1% move in the underlying stock. This is how much of a stock MMs must buy/sell per 1% move in order to remain neutral in their positions.
- "GEX/Volume" is the ratio for GEX (in shares) to the daily average trade volume (in shares).
- The "Flip Point" is the level where gamma changes from positive to negative, or vice versa.
- "Naive GEX" calculations assume that investors are primarily selling calls and buying puts (Market Markers buy the calls and sell the puts, then hedge their positive delta by shorting shares). We no longer track this because it is of limited use.
- Stocks under $5 generally have widely spaced option strikes relative to trade price (in percentage terms), which makes them prone to a larger margin of error in the GEX calculations. These stocks are generally best avoided.
- Based on the price of options, each stock has an Implied Volatility (IV). The Implied Volatility defines the one standard deviation move over a given period of time.
- "Expected Move" is defined as a One Standard Deviation Move, derived from the stock's current Implied Volatility.
- We measure skew three different ways.
- 25-Delta Risk Reversal: Measures the percentage IV premium of 25-delta puts over 25-delta calls. Positive = stronger downside hedge demand. Negative = call-side skew. e.g. "38% == Puts at 25-delta are 38% more expensive thatn calls at 25-delta"
- 1σ Wing Skew: Put IV minus Call IV for options that are one standard deviation out-of-the-money with ~ 30 days to expiration.
- Delta Skew: Call Deltas minus Put Delta for options that are one standard deviation out-of-the-money with ~ 30 days to expiration.
- A stock with a positive 25-Delta Risk Reversal has option demand skewed toward puts.
- A stock with a negative 25-Delta Risk Reversal has option demand skewed toward calls.
- Sentiment can be evaluated by comparing the Current values vs their historical percentiles (See advanced metrics).
Practical Strategies Using Our Gamma Data
1. Spotting a Gamma Squeeze
2. GEX Flip
3. Breakout from Consolidation
4. Directional Bias (Bullish)
Combine high call skew, negative GEX, and price confirmation → Call spread.
5. Low IV + Big Move Expected
Use a straddle when historical IV is low but GEX is strongly negative.
6. High IV + Range-Bound
Condor, butterfly, or short strangle work best with high IV and positive GEX.
***Other essential principles of trading options***
GEX Data Table Details:
Other GEX Notes:
Data Download notes: There is a "Rating" column in the csv sheets when you download historical data. Below is the code:
1 = "Bearish" - A Downward trend is in effect.
2 = "Wait" - Transitional setups, usually occurs when a stock is attempting a bottom
3 = "Avoid" - Lacks strong direciton.
4 = "Hold" - While in an upward trend, a consolidation period of lower prices is likely.
5 = "Bullish" - A Upwnward trend is in effect.
Implied Volatility Changes:
- Large changes in IV that are not accompanied by large price changes in the underlying are often a prelude to underlying price movements.
Skew Data Table Details:
- Our data looks at all options with less than 94 days to expiration.
- "1 Standard Deviation" is calculated using an average of IVs around the At-The-Money strikes, and then converted to dollars of share price for the given period.